Take two businesses, competing in the same industry, in the same city, and both trying to fill the same position. The only difference is that one is bigger than the other. Suppose one has 20 employees, while the other has 40. What happens when these businesses post their openings? The bigger one gets 12% more applicants. In other words, holding fixed the job title, the industry, and the city, every doubling in a company’s size brings roughly 12% more applicants. Because finding and recruiting good workers is so critical to business success, this puts the average small business at a disadvantage relative to its bigger competitors.
But that’s just an average, and it’s not always true. In St. Louis, MO, the bigger firm gets only 5% more applicants; in Providence, RI, there’s essentially no difference. And in many cities (such as Dallas, Fresno, and El Paso) it’s the opposite: Small companies can get 20% more applicants than their big competitors. Why is this? It’s not that workers are desperate, and it’s not because they don’t have a choice. It’s because in many cities in America, workers would just rather work for a small business. That’s our topic today.
Measuring the Small Business Advantage
We wanted to know where small businesses had the best edge in recruiting workers. So we looked at all ZipRecruiter posts from 2017 (almost 6 million posts!) and compared the number of applications received with the size of the company. We defined a small company as one with 20 or fewer employees (these account for 55% of ZipRecruiter posts) and a large company as one with 500 or more employees, but the results aren’t sensitive to these cutoffs.
Different posts can get different numbers of applicants for a lot of reasons. For example, manufacturing companies tend to be very large, and manufacturing jobs tend to attract many applicants. So in a city with many manufacturing companies (say Chicago), we might see big companies get far more applicants than small ones. But this isn’t because small businesses in Chicago are at a disadvantage; this is because of the structure of Chicago’s economy.
So to ensure we’re comparing apples to apples, we used a technique called “fixed effects” to compare the number of applications received by large and small businesses, holding fixed the industry they’re in and the job title of opening. That way, we’re always comparing similar openings between large and small businesses, in the same city and industry, and for the same job title. There’s more detail in the technical notes at the bottom.
Lots of Variation in the Small Business Advantage
On average, posts from smaller companies get fewer applications than comparable ones from very big companies. But no city perfectly fits the “average” and there are big differences in the large/small gap, including cities where small businesses are at an advantage and get more applicants.
Table 1 breaks metros into four groups. Metros where small businesses (20 or fewer employees) see a big applicant advantage over their bigger competitors (500 or more employees) are at the top. There, a post by a small business is expected to get at least 20% more applicants the same post would get coming from a large business.
Table 1. The Small Business Advantage/Disadvantage
| Group | Application difference (Small businesses get…) | Number of cities | Biggest cities |
|---|---|---|---|
| Big small biz advantage | 20+% more applicants | 24 | Dallas, TX El Paso, TX Wichita, KS |
| Modest small biz advantage | 0-20% more applicants | 26 | Providence, RI Fresno, CA Bridgeport, CT |
| Modest small biz disadvantage | 0-20% fewer applicants | 61 | Miami, FL Tampa, FL Denver, CO |
| Big small biz disadvantage | 20+% fewer applicants | 241 | New York, NY Los Angeles, CA Chicago, IL |
Do Workers Really Have Any Choice? Yes.
The table also shows cities with a modest small business advantage (small businesses postings get more applicants, but not 20% more), a modest small business disadvantage, and a large small business disadvantage. The biggest three metros in the US (New York, LA, and Chicago) appear in this last group, but in general, there’s no correlation between a city’s population and it’s Large/Small gap.
Why are workers in some cities more eager to apply to small businesses than in others? A cynic might guess that they have little choice. Perhaps all workers prefer big companies, but in some cities, they just don’t have a choice. We find that isn’t the case.
First, we compare the Large/Small difference with unemployment. If workers only apply to small businesses out of necessity, then cities with high unemployment should be the ones where applicants target small businesses. That’s not the case. The correlation with unemployment is tiny (.02) and statistically insignificant. Unemployment has nothing to do with why workers choose small businesses.
It could, instead, be that there aren’t any openings at big companies. Nah, that’s not it either. The correlation with the number of posts from large businesses (adjusted for population) is small (.08), but if anything, it suggests that cities where workers are more friendly towards small businesses see more posts by both small and large businesses. Workers have more choices; they’re not being pushed towards small companies unwillingly.
Similarly, in the cities where applicants’ are more friendly towards small companies it’s not because there’s a lower rate of small business failure, or lower income, or less affordable housing. It’s not desperation, it’s because people in these cities like to work at small businesses.
Where are the Best Markets for Small Businesses?
So if none of these factors explain why small businesses have an advantage in some cities and a disadvantage in others, then what does? Placement.
Figure 2 maps the 352 metros we consider. The green metros are those where small businesses have the biggest advantage in applications. The blue ones are fairly moderate; small businesses neither have a substantial advantage or disadvantage. In the gray metros, though, small companies received 20% or fewer applications than large companies.
Figure 2. The Best Cities for Small Business
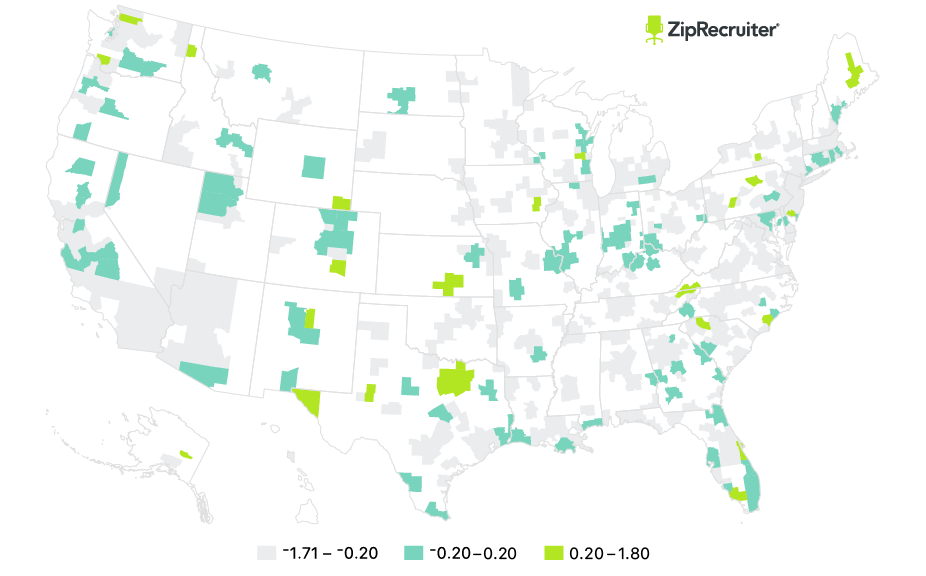
As you can see, metros in the Southwest (including Texas and Arizona) and the Rocky Mountains (including Colorado and Utah) really stand out. Small companies in these regions are most likely to receive more applications than bigger competitors. New England (including Massachusetts and Connecticut) and the Far West (including California and Washington) stand just behind them. At the other end are metros in the Mideast (including New York and Pennsylvania) and Great Lakes (including Illinois and Ohio) regions where applicants show the biggest bias towards big businesses.
Conclusion
Small businesses are critical to the US economy. Being small brings many advantages, but also many challenges. One of these is finding and recruiting good workers, who often prefer to work for large companies. But not everywhere.
In cities like Dallas, El Paso, and Wichita, an opening at a small company attracts dramatically more applications than the same opening would at a big company. This isn’t because of economic hardship or desperation; it’s because workers in the Southwest and Rocky mountain regions just prefer working for small companies. With creativity and innovation more important than ever for the US economy, we’ll see if this preference continues to drive growth in these cities and whether the rest of the country can catch up.
Technical notes
The main results are based on separate MSA-level regressions including fixed effects (dummy variables) for job title, industry, and month of posting. This ensures that we’re always comparing applications received between large and small companies within the same industry, for posts with the same job title, and with the same month of posting. The dependent variable is the log of the number of applications a post received, and the key independent variable is a dummy for whether the company filing the posting is small (20 employees or fewer). We restrict to companies that are either small or large (defined as 500 employees or more).
All of the substantive conclusions are consistent if we use all companies (including those with between 20 and 500 employees) and use the log number of employees as our key independent variable (instead of the dummy for “small company”).
We follow the common (though controversial) practice of adding one to all of the application counts (before taking logs) so that we do not lose postings that get zero applicants.
We exclude January due to data inconsistencies. Our full sample includes 5.5 million posts. We only estimate the regression for MSA’s with a total of more than 500 posts from large and small companies.
All data not discussed above comes from our annual Best Job Markets report or from the Census Bureau’s Business Dynamics Statistics program.